Kubernetes Pod OOMKilled: Why Exit Code 137 Happens Below Your Limits
Kubernetes pod OOMKilled with exit code 137 appears in kubectl describe pod even when your application’s own memory settings look completely fine — your JVM heap is capped at 512MB, your Node.js --max-old-space-size is set to 768MB, your container memory limit is 1Gi, and the math says you should have headroom. The pod still gets killed. The reason is that your runtime’s memory setting controls one specific region of memory — the managed heap — while the kernel’s cgroup memory accounting that triggers OOMKilled counts everything: heap, metaspace, thread stacks, off-heap buffers, native library allocations, and memory-mapped files. This page covers exactly what cgroup memory limits measure, why runtime heap flags do not protect you from them, and how to size container limits correctly for Java, Node.js, Python, and Go.
Covers Kubernetes 1.25+ with cgroups v2, and Docker with equivalent cgroup-based memory limits. Diagnostic commands work with both kubectl and direct docker access.
TL;DR
- Exit code 137 means the process received SIGKILL (128 + signal 9) — in Kubernetes, this is almost always the OOM killer triggered by cgroup memory limits
- Exit code 143 means SIGTERM (128 + signal 15) — a graceful shutdown request, not an OOM kill. Confusing these two delays diagnosis significantly
- cgroup memory limits count RSS for the entire process — heap, stack, metaspace, off-heap buffers, shared libraries — not just what your runtime’s heap flag controls
- JVM
-Xmxcontrols only the heap; metaspace, thread stacks, and direct buffers are additional memory the JVM uses that-Xmxdoes not cap - Node.js
--max-old-space-sizecontrols only the V8 heap; Buffer allocations and other off-heap memory are not counted against it but ARE counted against the cgroup limit - The fix is always the same shape: set container memory limit comfortably above your runtime’s heap setting, accounting for the runtime’s specific off-heap overhead
Kubernetes Pod OOMKilled: What Exit Code 137 Actually Means
Exit code 137 is not a custom Kubernetes error code — it is 128 + 9, where 9 is the signal number for SIGKILL. Any process killed with SIGKILL exits with code 137, regardless of what killed it. In a Kubernetes context, when you see exit code 137 combined with OOMKilled as the reason in kubectl describe pod, the kernel’s cgroup memory controller detected that the container’s memory usage exceeded its configured limit and sent SIGKILL to the process — there is no graceful shutdown, no chance to flush buffers or close connections.
The snippet below shows the exact kubectl describe pod output fields that confirm an OOM kill versus other causes of container termination. The Reason field is the definitive signal — OOMKilled appears only when the cgroup memory controller triggered the kill, distinct from Error (non-zero exit from the application itself) or Completed.
# kubectl describe pod output — confirming an OOM kill
kubectl describe pod my-app-7d9f8b6c5-x2k9p

# Relevant fields in the output:
# Last State: Terminated
# Reason: OOMKilled <- confirms cgroup memory limit was exceeded
# Exit Code: 137 <- SIGKILL (128 + 9)
# Started: Mon, 10 Jun 2026 14:22:01 +0000
# Finished: Mon, 10 Jun 2026 14:31:47 +0000
Without checking the Reason field specifically, exit code 137 alone can be mistaken for other failure types — a script calling kill -9 on the process, a node-level eviction, or a manual docker kill all produce the same exit code. The OOMKilled reason is what narrows the cause to cgroup memory enforcement specifically, which is the starting point for everything else on this page.
Exit Code 137 vs 143: What’s the Difference?
Exit code 143 is 128 + 15 — SIGTERM, a graceful termination request. Kubernetes sends SIGTERM during normal pod shutdown (scale-down, rolling update, node drain) and gives the process a grace period — default 30 seconds — to shut down cleanly before escalating to SIGKILL (137) if it has not exited. If you see exit code 143, your application received a normal shutdown signal and either handled it correctly or timed out. If you see 137 with Reason: OOMKilled, there was no grace period — the kernel killed the process the instant it crossed the memory limit. The two codes look similar numerically but represent fundamentally different events: 143 is “please stop,” 137 (with OOMKilled) is “you exceeded your memory and were killed immediately.”
Why Does My Pod Get OOMKilled When Memory Usage Looks Fine?
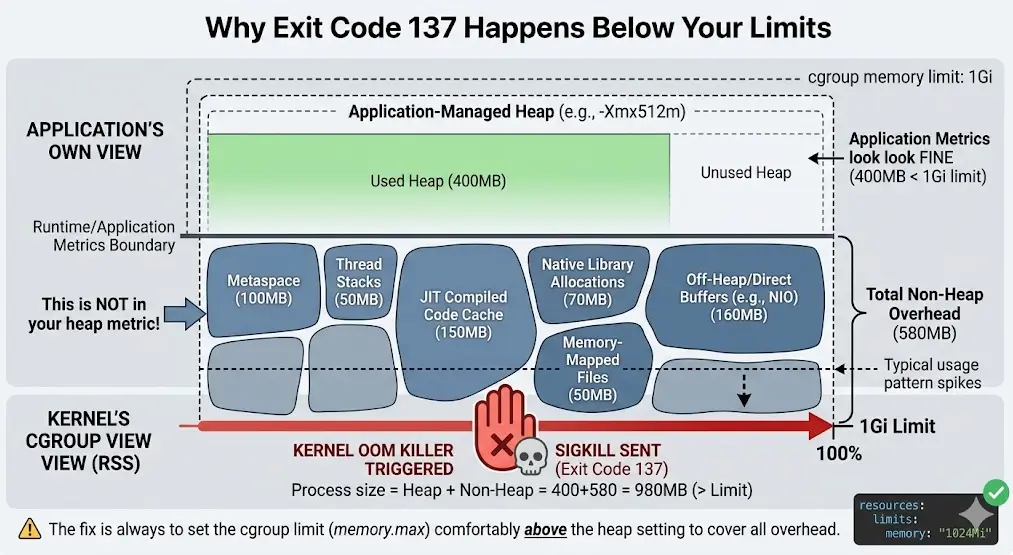
“Looks fine” almost always means your application-level memory metric — JVM heap usage, Node.js process.memoryUsage().heapUsed, a Python memory profiler — is below the container limit, while the cgroup’s view of total process memory is not. These are different measurements. Your runtime’s heap metric measures one region of memory that the runtime manages directly. The cgroup measures the resident set size (RSS) of the entire container, including memory your runtime allocated but does not report in its heap statistics — native thread stacks, JIT compiled code caches, memory-mapped libraries, and any off-heap buffers. A process can show 60% heap utilization in its own metrics while consuming 100% of the cgroup’s memory limit through everything else.
Why Rust Rejects Code That Seems Correct Rust borrow checker errors occur when the compiler detects ownership or reference conflicts that would cause memory unsafety — and it refuses to compile rather than let that...
cgroup Memory Limit: How the OOM Killer Decides What to Kill
A Kubernetes container memory limit is enforced through a Linux cgroup — either memory.max (cgroups v2) or memory.limit_in_bytes (cgroups v1). When the total memory charged to that cgroup — which includes anonymous memory, page cache pages attributed to the cgroup, and kernel memory used on the cgroup’s behalf — reaches the limit, the kernel’s OOM killer activates within that cgroup’s scope and selects a process to kill, almost always the largest consumer, which in a single-process container is your application.
This is a hard limit with no soft warning period at the application level. There is no signal sent before the kill that says “you are approaching your limit” — the process is either under the limit and running, or over the limit and dead. The snippet below shows how to read the current memory usage and limit directly from the cgroup filesystem, which is the ground truth the kernel uses — more accurate for this purpose than any application-level memory metric.
# Reading cgroup memory stats directly (cgroups v2)
# Run inside the container, or via kubectl exec

cat /sys/fs/cgroup/memory.current # current memory usage in bytes - the kernel's view
cat /sys/fs/cgroup/memory.max # the hard limit - matches your resources.limits.memory

# memory.current includes EVERYTHING: heap, stacks, page cache, mmap'd files
# Compare this to your runtime's heap metric - the gap is your off-heap overhead
Without checking memory.current against your runtime’s own heap metric, you are debugging with only half the picture. A JVM reporting 400MB heap usage inside a container with memory.current at 980MB and memory.max at 1Gi tells you the 580MB gap is metaspace, thread stacks, JIT caches, and direct buffers — and that gap, not the heap, is what will trigger the next OOM kill.
Kubernetes Requests vs Limits: How Memory Limits Are Set
resources.requests.memory is used for scheduling — Kubernetes places the pod on a node with at least that much memory available, but it is not enforced as a ceiling. resources.limits.memory is what becomes the cgroup memory.max — this is the hard ceiling that triggers OOMKilled when exceeded. Setting requests and limits to the same value (a common production pattern called “Guaranteed” QoS) means the pod gets a predictable memory allocation with no risk of being squeezed by other pods on the node, but also means there is zero headroom — any spike above the limit, even briefly, results in an immediate kill with no opportunity to recover.
OOM Score Adjustment: Why This Process Was Chosen
Each process has an oom_score_adj value that influences the kernel’s choice of victim when memory pressure occurs at the node level (as opposed to a single cgroup hitting its own limit). Kubernetes sets this value based on QoS class — Guaranteed pods get a lower score (less likely to be killed first), BestEffort pods get a higher score (more likely to be killed first) during node-level memory pressure. This is a separate mechanism from the per-container cgroup limit kill — a container can be OOMKilled purely for exceeding its own memory.max regardless of oom_score_adj, which only matters when the kernel is choosing among multiple processes during system-wide memory pressure.
Java OOMKilled Docker: Heap Size vs Container Memory Limit
A JVM running with -Xmx512m inside a container with a 512Mi memory limit will get OOMKilled — not occasionally, but reliably, often within minutes of startup under any real load. -Xmx caps the heap. It does not cap metaspace (class metadata, can be 50-200MB depending on the number of loaded classes), thread stacks (default 1MB per thread — 50 threads is 50MB), the JIT code cache (default up to 240MB on modern JVMs), or direct ByteBuffers used by NIO and many libraries for I/O. All of these are counted by the cgroup; none of them are counted against -Xmx.
# Java — WRONG vs RIGHT: heap size relative to container memory limit

# WRONG: heap size equals container limit - guaranteed OOMKilled under load
# Container memory limit: 512Mi
java -Xmx512m -jar app.jar
# Total process memory = heap (up to 512MB) + metaspace + stacks + JIT cache
# + direct buffers = easily 650-750MB, exceeding the 512Mi cgroup limit

# RIGHT: heap is roughly 60-70% of container limit, leaving room for the rest
# Container memory limit: 1024Mi (1Gi)
java -Xmx640m -XX:MaxMetaspaceSize=128m -XX:MaxDirectMemorySize=128m -jar app.jar
# Heap (640MB) + metaspace (capped 128MB) + direct buffers (capped 128MB)
# + stacks/JIT (~50-80MB) = ~950MB, under the 1Gi limit with margin
Without explicitly capping metaspace and direct memory alongside the heap, both are allowed to grow based on application behavior — a class-loading-heavy framework or a library using large direct buffers for I/O can push these regions well past their typical size, and because the cgroup limit is the only thing enforcing a ceiling on them, the result is an OOM kill that has nothing to do with your heap being too small.
Java -XX:+UseContainerSupport: Does It Fix This Automatically?
Modern JVMs (10+) enable container support by default, which makes the JVM aware of the cgroup memory limit and set default heap sizing as a fraction of it — typically 25% of the container limit for -Xmx if not explicitly set. This prevents the most naive failure mode (a JVM defaulting to a heap size based on host memory inside a constrained container), but it does not solve the problem this page covers — even with container-aware defaults, metaspace, thread stacks, and direct buffers are still uncapped additional consumers. Container awareness gets you a heap size that fits within the limit; it does not account for everything else that also needs to fit.
Solve TypeError: 'NoneType' object is not subscriptable in Python TypeError: 'NoneType' object is not subscriptable means you're trying to use [] on a variable that is None. Check if the variable is None before indexing...
Node.js and Python OOMKilled: Off-Heap Memory in Containers
Node.js --max-old-space-size controls the V8 heap — the same region that process.memoryUsage().heapUsed reports. It does not control external memory: Buffer allocations, ArrayBuffers, and native module memory all live outside the V8 heap and are not capped by --max-old-space-size. A Node.js service processing large file uploads or streaming responses can have a V8 heap comfortably under its limit while Buffer-backed external memory pushes total RSS over the container’s cgroup limit — resulting in OOMKilled with the heap metric showing nothing alarming.
# Node.js — checking the gap between V8 heap and total process memory
const mem = process.memoryUsage();

// heapUsed: what --max-old-space-size controls
console.log(`heap: ${(mem.heapUsed / 1024 / 1024).toFixed(0)}MB`);

// external: Buffer/ArrayBuffer memory - NOT controlled by --max-old-space-size
// but IS counted by the cgroup memory limit that triggers OOMKilled
console.log(`external: ${(mem.external / 1024 / 1024).toFixed(0)}MB`);

// rss: what the cgroup actually measures against memory.max
console.log(`rss: ${(mem.rss / 1024 / 1024).toFixed(0)}MB`);
Without monitoring external and rss alongside heapUsed in a containerized Node.js service, a Buffer-heavy workload can be silently consuming the gap between heap usage and the cgroup limit — and when that gap closes, the OOM kill happens with the heap metric looking completely normal in whatever dashboard you are watching.
Python OOMKilled: No Built-In Heap Limit Means No Early Warning
Python has no equivalent to -Xmx or --max-old-space-size — there is no built-in mechanism that caps the interpreter’s memory usage below the system limit and raises a catchable error when approached. A Python process grows until the cgroup kills it, with no intermediate warning state. This makes Python containers particularly prone to OOMKilled appearing “suddenly” — there is no gradual degradation or warning metric analogous to “heap utilization climbing toward the cap.” The only proactive option is application-level monitoring — tracking resource.getrusage(resource.RUSAGE_SELF).ru_maxrss or reading /sys/fs/cgroup/memory.current directly and alerting on it approaching the limit, since the runtime itself provides no equivalent safeguard.
Go OOMKilled: GOGC and Memory Limit Tuning
Go’s garbage collector is triggered by heap growth ratio (GOGC, default 100 — collect when heap doubles since the last collection), not by an absolute memory ceiling, which means a Go process’s memory usage can spike well above its typical working set between collections, especially under bursty allocation patterns. Since Go 1.19, GOMEMLIMIT provides a soft memory target that makes the GC more aggressive as usage approaches it — setting GOMEMLIMIT to roughly 80-90% of the container’s cgroup limit gives the GC a target to actively avoid before the hard cgroup limit triggers OOMKilled, which GOGC tuning alone does not provide since it is a ratio, not an absolute ceiling aware of the container.
How to Debug OOMKilled in Kubernetes: A Systematic Approach
Debugging an OOMKilled pod follows a specific sequence: confirm it is actually an OOM kill (not a different exit code or termination reason), measure the gap between your runtime’s heap metric and the cgroup’s actual memory usage, identify which off-heap category is consuming that gap, and then either reduce that consumption or raise the container limit to account for it.
Step 1 — Confirm with kubectl describe. Check Reason: OOMKilled and Exit Code: 137 specifically. If the reason is different (Error, Completed, or a different exit code), this page’s diagnosis does not apply — investigate the application’s own exit behavior instead.
Step 2 — Compare runtime heap metric to cgroup memory.current at the same point in time. If you can catch the process shortly before a kill (or reproduce the load pattern in a test environment with a higher limit), log both values together. A large and growing gap is your off-heap overhead.
Step 3 — Identify the off-heap category for your runtime. Java: metaspace, direct buffers, thread count × stack size. Node.js: external memory from Buffers. Python: no single category — profile with tracemalloc and check for native extension memory. Go: heap growth between GC cycles, controllable via GOMEMLIMIT.
Step 4 — Fix at the source or raise the limit with margin. If the off-heap consumption is a leak (growing unboundedly), fix the leak — this page’s diagnosis tells you where to look, the specific leak fix depends on the category. If the off-heap consumption is legitimate and bounded but simply larger than your limit accounted for, raise resources.limits.memory to cover heap plus the measured off-heap overhead plus a safety margin — typically 20-30%.
# Setting a memory limit with margin for off-heap overhead (Kubernetes manifest)
resources:
 requests:
 memory: "768Mi" # scheduling baseline
 limits:
 memory: "1024Mi" # hard ceiling - must cover heap + off-heap + margin

# For a JVM: -Xmx640m leaves ~384Mi for metaspace, stacks, direct buffers
# For Node.js: --max-old-space-size=640 leaves ~384Mi for Buffer/external memory
# The gap between heap setting and container limit is NOT wasted -
# it is the off-heap overhead that would otherwise trigger OOMKilled
Without explicitly reserving this gap, the natural instinct is to set the heap flag equal to (or very close to) the container limit, on the assumption that “the heap is the memory the application uses.” For every runtime covered on this page, that assumption is false, and the gap is not optional headroom — it is memory the runtime needs for things the heap flag does not account for.
Cannot Read Properties of Undefined in JavaScript: Causes and Fixes The error TypeError: Cannot read properties of undefined stops your JavaScript execution cold — and it shows up in the console with zero mercy. You...
FAQ: Kubernetes Pod OOMKilled and Exit Code 137
What does exit code 137 mean in Kubernetes?
Exit code 137 is 128 + 9, representing SIGKILL. In Kubernetes, this combined with Reason: OOMKilled in kubectl describe pod means the cgroup memory controller killed the container for exceeding its memory limit. Exit code 137 alone (without checking the Reason field) can also result from a manual kill -9 or a node-level eviction — always check the Reason field to confirm it was specifically an OOM kill before debugging memory.
Why does my pod get OOMKilled when application memory metrics look normal?
Because application-level memory metrics (JVM heap, Node.js heapUsed, Python’s tracked allocations) measure a specific region of memory that your runtime manages directly, while the cgroup limit that triggers OOMKilled measures the total resident memory of the entire process — including metaspace, thread stacks, JIT caches, off-heap buffers, and native library allocations. A process can have low heap utilization while its total RSS, which is what the kernel checks, is at or above the container’s memory limit.
What is the difference between exit code 137 and 143?
Exit code 143 is 128 + 15 (SIGTERM) — a graceful shutdown request, typically sent during pod scale-down or rolling updates, with a grace period (default 30 seconds) before escalation. Exit code 137 is 128 + 9 (SIGKILL) — immediate termination with no grace period, used by the OOM killer when a cgroup memory limit is exceeded. If you see 143, your app received a normal shutdown signal. If you see 137 with Reason OOMKilled, the kernel killed the process instantly for exceeding memory.
How do I set Java heap size correctly for a Kubernetes container?
Set -Xmx to roughly 60-70% of the container’s memory limit, and explicitly cap -XX:MaxMetaspaceSize and -XX:MaxDirectMemorySize rather than leaving them unbounded. The remaining 30-40% of the container limit covers metaspace, thread stacks, JIT compiled code cache, and direct buffers — none of which are capped by -Xmx alone. Modern JVMs with container support enabled (default since Java 10) set a reasonable default heap fraction automatically, but do not cap the other regions, so explicit limits on metaspace and direct memory remain necessary.
Does –max-old-space-size prevent Node.js from getting OOMKilled?
Not completely. --max-old-space-size caps the V8 heap, which is what process.memoryUsage().heapUsed reports. It does not cap external memory — Buffer and ArrayBuffer allocations, which are counted in process.memoryUsage().external and are part of the RSS that the cgroup memory limit measures. A Node.js process can have heap usage well under --max-old-space-size while Buffer-heavy operations push total RSS over the container’s memory limit, resulting in OOMKilled.
How can I monitor for OOMKilled before it happens?
Read /sys/fs/cgroup/memory.current (cgroups v2) directly and compare it to /sys/fs/cgroup/memory.max — this is the kernel’s exact view and the only metric guaranteed to reflect what triggers the OOM killer. Combine this with your runtime’s own heap metric to track the gap between heap usage and total cgroup usage over time. An alert when memory.current exceeds roughly 85-90% of memory.max provides warning before the hard kill, which no application-level heap metric alone can provide.
Why does increasing the memory limit not always fix OOMKilled?
If the off-heap memory consumption is an actual leak — a growing cache, accumulating Buffer references, a metaspace leak from dynamic class generation — increasing the limit only delays the kill, since the leak will eventually consume any limit given enough time. Increasing the limit is the correct fix only when the off-heap overhead is bounded and legitimate (a fixed-size thread pool’s stack memory, a fixed direct buffer pool) but was simply not accounted for in the original limit. Distinguishing a leak from a legitimate bounded overhead requires watching whether the gap between heap usage and cgroup usage grows over time or stabilizes.
Does GOMEMLIMIT prevent Go programs from being OOMKilled?
GOMEMLIMIT, available since Go 1.19, gives the garbage collector a soft memory target that it actively works to stay under by collecting more aggressively as usage approaches the limit. Setting it to roughly 80-90% of the container’s cgroup memory limit reduces the likelihood of OOMKilled by giving the GC a container-aware target, which the default GOGC ratio-based trigger does not provide on its own. It is a soft target, not a hard cap — under extreme allocation bursts that outpace GC, a Go process can still exceed GOMEMLIMIT and subsequently the cgroup limit, resulting in OOMKilled.
Written by: